The Category Metric tiles display a numeral to represent the value for the category with the Category label below.
Hover over a tile to display the definition of and additional information for the category.
Each tile acts as a filter for the category and selecting filter options in the graphs will update the data in the metric tiles. Click on a tile and the onscreen data updates, reflecting selected category metrics in the chart(s) and grid(s).
To select multiple category tiles, hold the Ctrl key (keyboard) and click on tiles. The onscreen data updates based on your selections and multiple charts display (based on category). Grid column headers reflect the data display.
Refer to View More Detail (button) for additional features available for Category Metric grids.
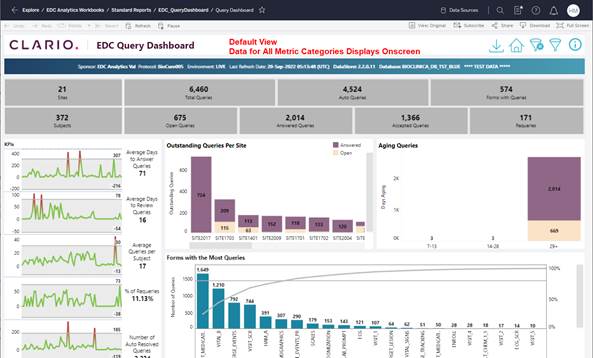
Figure 61: Default View Includes Data for All Metric Categories
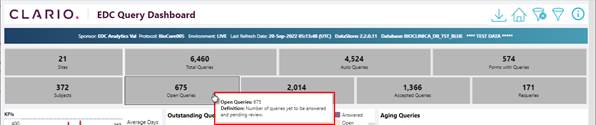
Figure 62: Hover Over a Tile to Display Detail
for the Metric Category
Related Topics