Click on a segment (metric) in either chart to filter
information in both charts and the tiles above by the selected metric(s). The Form/Query List grid populates (replacing
the Pareto chart) to display results for the selection(s).
·
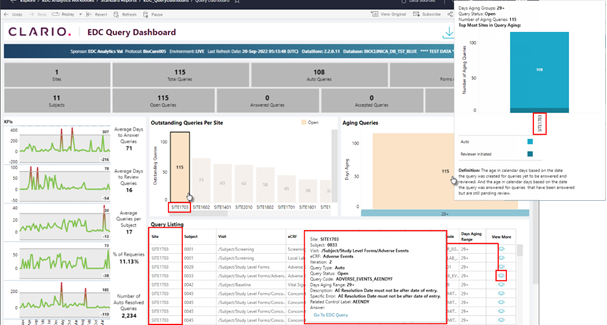
Figure below shows screen results after
user clicks on the Open Query metric (Site 1703). The charts and tiles update, and the Query
Listing grid populates with related results.
Figure 67: Click on a Chart Metric to Select Filters (Example 1)
·
Figure below shows screen results
after user clicks on the Open Query metric for Queries Aged 29+ days. The Outstanding Queries Per Site chart and
tiles above update and the Form/Query Listing grid populates with related
results.
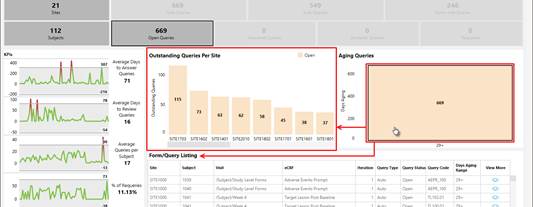
Figure 68: Click on a Chart Metric to Select
Filters (Example 2)
Outstanding Queries Per Site
This chart contains detail (by site) for the number of
queries not yet answered and for queries answered that are not yet
reviewed.
Aging Queries
This chart contains detail (by site upon hover) for the age
in calendar days (based on the date the query was created) for queries that
are not yet answered and reviewed.
Additionally, the “age in calendar days” is based on the date the query
was answered for queries that are answered but still pending review.
·
Hover over a metric to display
onscreen information for the selection.
·
Click on any bar in either graph or a
label on the x-axis
(horizontal)
below any graph to filter all onscreen data for your selection. Hold the Ctrl key (keyboard) and click on
bars and/or labels to filter on multiple metrics.
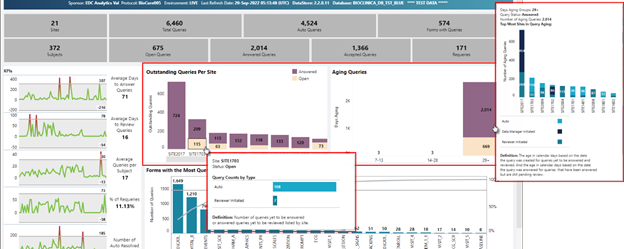
Figure 69: Hover Over a Bar Chart Metric To Display Additional Information
Related Topics