Use the View More (![]() )
button to display additional detail and a link to the EDC system (when
applicable to the data metric). Use the
horizontal scroll bar (located below the grid) to navigate to the far right
column, as needed. Optionally, click in
a cell of the grid to display a link to the EDC system, then click the link to
open the system in a new tab.
)
button to display additional detail and a link to the EDC system (when
applicable to the data metric). Use the
horizontal scroll bar (located below the grid) to navigate to the far right
column, as needed. Optionally, click in
a cell of the grid to display a link to the EDC system, then click the link to
open the system in a new tab.
1.
On the
Dashboard screen, click on a metric tile (top of screen) or a bar in a graph.
2.
The Form/Query
List grid populates (below the bar graphs) with data for the selection.
3.
Hover over
the View More (![]() ) button, located in a cell or at the right
side of grid.
) button, located in a cell or at the right
side of grid.
a. Onscreen information for the selection displays
detail and may contain a link to the EDC.
b. Based on the dashboard, link to the EDC may
display when you hover over a cell.
4.
Optionally,
click a link to open/navigate to the EDC system in a new tab.
Refer to View More Detail (button) and Open the EDC System with a Click for details about additional features.
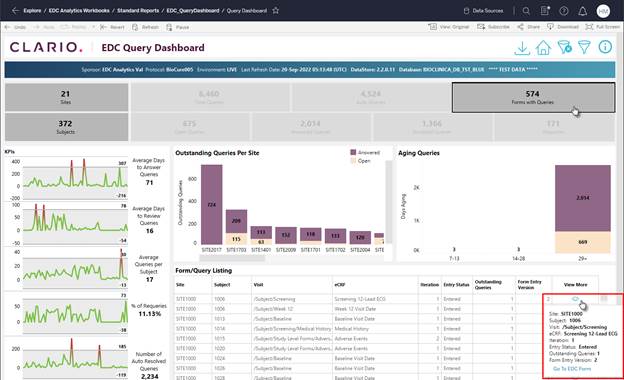
Figure 63: Navigate to the EDC from the EDC Analytics System
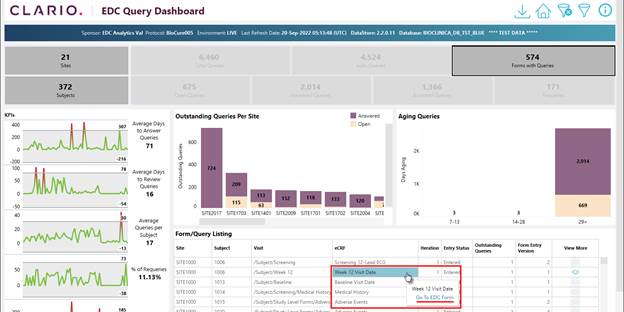
Figure 64: Selected Grid Cells Contain a Link to the EDC System
Related Topics
Common Dashboard Features and Navigation