By default, all category data displays (permission based).
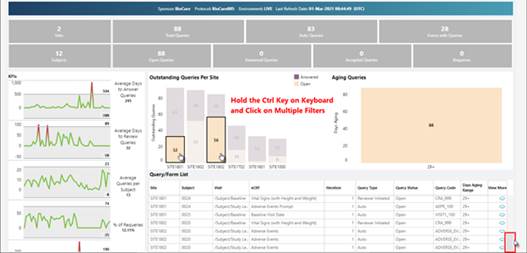
Click on tiles and chart elements to select and deselect options. Hold the Ctrl key (keyboard) to select
multiple options. Additionally, hold the
Ctrl key (keyboard) to click on a selected element in order to deselect it.
Similar to other filters in this system, the dashboard Tiles,
Charts, and Graphs update to display only data that is relevant for the
selected options.
Figure 57: Multiple Filter Options
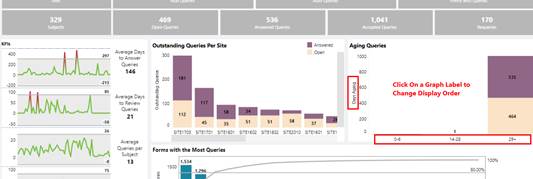
Figure 58: Click on a Graph Label to Change Display Order
Refer to Select an Environment for details about using the Filter Environment
button. Refer to KPI Data for details about the “Only Filters KPI” filter
option.
Related Topics
Dashboard Elements Filter Functionality